Interactive Insights

Recruiting Warehouse Workers

A Deep Dive into Talent Sourcing and Recruitment Advertising Benchmarks

Warehouse Workers

A Bit About These Talented Professionals

Mighty movers and warehouse warriors! Our champions of the logistics industry, laborers and freight, stock, and material movers are the backbone of the supply chain, working tirelessly to keep the wheels of commerce turning. From hectic distribution centers to bustling construction sites, these industrious individuals are always on the move, bringing order to chaos and making the impossible happen.

Projected employment for this occupation is a bit of a mixed bag, ranging from 0-6% through 2031. But, between occupational drain and job creation, this translates to more than one million openings per year.

For some warehouse roles, as well as grocery checkout, automation is replacing the hoo-mans, while movers, cleaners, refuse and recyclable material collectors, and stockers will remain in demand. However, hold onto your packing tape, as companies are unveiling automated storage and retrieval tools like scanners and radio frequency identification (RFID) tags, making tasks a breeze for stockers and order fillers and increasing efficiency.

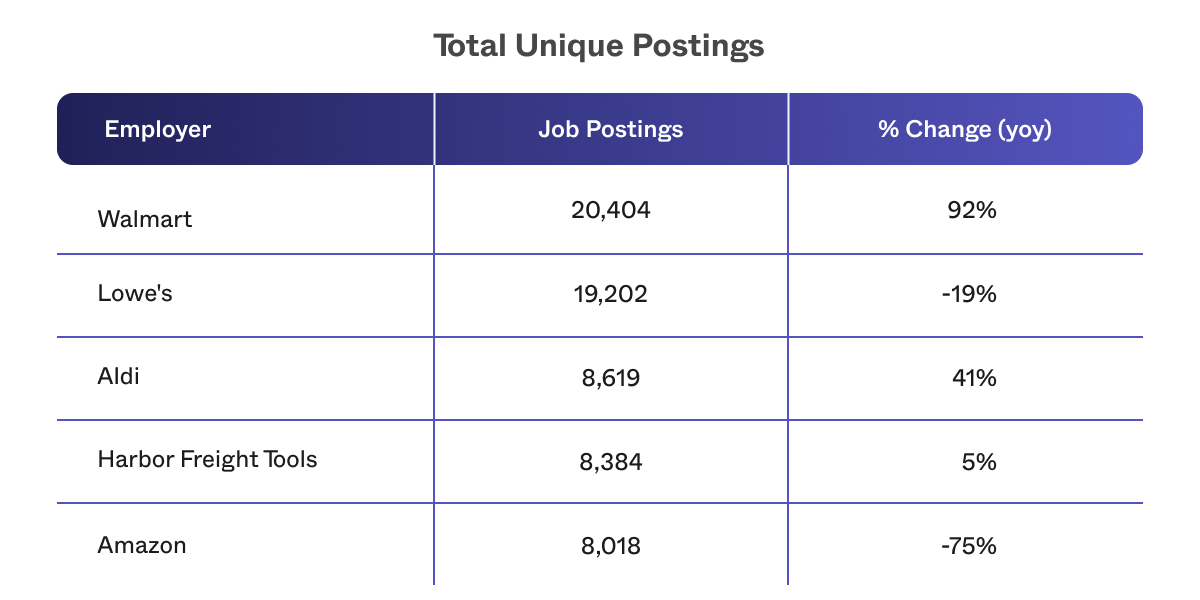
Let’s unpack the great info below and get you recruiting great-fit talent, at the optimal cost.

It’s time to let Joveo’s data do the talking!

0%
Year-on-year decrease in CPC
0%
Year-on-year increase in median advertised salary
0%
Year-on-year decrease in unique postings

CPC, Ya You Know Me!

H2 2022 saw a predictable increase in CPCs Cost per click (CPC) is the amount paid for every click on a job ad. leading up to the holiday season, which peaked in November. In the post-holiday lull, CPCs plummeted by 50%, hitting a 12-month low in January 2023. But they’re on their way back up in H1 2023, with unique postings growing by 29%, alongside a 29% increase in CPCs. This is indicative of leaders in the warehousing business feeling more confident about a return to macroeconomic normalcy, recovery in the consumer sector, and adherence to seasonal patterns, as we move into hiring mode.

Recommendation: Leverage this data, understand seasonality and macro trends, and stay nimble!

Source: Joveo Research

The State of CPCs Across the Nation

Nationally, we are seeing an average CPC of $0.81… but let’s take a closer look, shall we? Drilling down to CPCs by state, we find a decent range. Leading the pack as the least expensive states to garner a click are Rhode Island ($0.60), Louisiana ($0.58), and New Mexico ($0.52). On the other end of the spectrum, where clicks will cost the most, we find Wyoming ($1.44), Alaska ($1.58), and South Dakota ($1.85).

Recommendation: Use this insightful info to track and compare performance across states and do a little A/B testing A/B testing refers to a randomized experimentation process. Two or more versions of a variable (job title, job description, etc.) are shown to different segments of users at the same time. The goal is to determine which version leaves the maximum impact and drives conversions. to optimize those CPCs and conversion rates. Make sure you get the most bang for your recruitment marketing buck!

Source: Joveo Research

Demand-Supply: The Golden Ratio

There’s definite fluctuation in these numbers! While the average ratio of hires to postings is 7.03 over the past 12 months, we can see this dropping as low as five in June and hitting a peak of nearly 10 in February. What does this mean, you ask? Well, seven to ten hires are made for every posting, which is greatly influenced by seasonality in this particular occupation.

Recommendation: If your ratio is less than 7.03, we strongly recommend digging a little deeper. Perhaps an old fashioned recruitment marketing audit. That means reviewing job titles, descriptions, compensation, and benefits compared with your competition. Oh, and how could we neglect reach, ad dollars, and return on ad spend per source!

Source: Joveo Research

Mind Your Demand-Supply Gap… by State

Wondering how aggressive your sourcing needs to be in a given state? Well, we’ve got you covered with this nifty chart, giving insight into the demand-supply gap The demand-supply gap is calculated by dividing the number of unique job postings by total employment in the occupation. The higher the number, the greater the demand-supply gap, compared with the national average., and indicating just how aggressive you need to be when it comes to talent sourcing or job advertising.

For example, if you’re looking to hire in West Virginia, Mississippi, or Arkansas, you shouldn’t have a problem. In fact, these three top our list of easiest to fill states when we take a look at demand and supply. On the other end of the spectrum, filling your hiring funnel in Colorado, New Hampshire, and South Dakota is going to be a challenge, given the low supply and high demand!

Recommendation: If the color of your state is in the deep gold, it may indicate that you need to jazz up your job content, A/B test titles A/B testing refers to a randomized experimentation process. Two or more versions of a variable (web page, job description, etc.) are shown to different segments of users at the same time. The goal is to determine which version leaves the maximum impact and drives conversions., expand across locationsGeographic optimizations expand the targeted location to include surrounding communities. This is an easy way to extend your reach and reduce CPAs by sourcing from less competitive markets., and spend considerably more on recruitment marketing and job advertising to attract more great-fit candidates.

Source: Joveo Research

Who Posts the Most?

The competition is a bit fierce when it comes to recruiting laborers, with an average posting intensity Posting intensity is the ratio of total job postings to unique job postings. A higher posting intensity means employers are sending copies of their reqs to several job sites or other locations on the web, to reach a bigger talent pool. of 5:1 across the occupation, nationally. Top employers like Staples, PepsiCo, and The Salvation Army distribute their jobs with similar intensity, while other familiar faces like Penske (15:1) and UPS (20:1) go a step further, beating the national occupational average. Chewy tops them all with a mindblowing posting intensity of 58:1!

Recommendation: Be sure to get your posts out to all the right job boards and on social media. We may be a little biased, but one great way to automatically post jobs across the best-performing sites is to use programmatic job advertising – plus you can take advantage of job title Job title expansion means leveraging alternative job titles, using commonly searched terms. These are published as new listings in addition to the original post. and geographic Geographic optimizations expand the targeted location to include surrounding communities. This is an easy way to extend your reach and reduce CPAs by sourcing from less competitive markets. expansions.

Show Candidates the Money!

While the national median salary is approximately $33,000, advertised median salaries over a 12-month period hit $36,000, as of May of 2023. This delta is mostly due to two reasons: Employers with higher salaries are the ones that generally tend to advertise them. Also some employers tend to only advertise the upper end of their salary brackets. This gives them a decided competitive advantage when it comes to sourcing.

Recommendation: If you offer a great salary, don’t forget to call it out in your job description, even if your state doesn’t enforce it legally. Show them the money! Currently, 55% of unique job postings for laborers include wage info. This will help you attract more candidates, lower CPCs, and fill your funnel faster… And keep ahead of the Joneses!

Source: Joveo Research

An Eye on DE&I: How Do You Measure Up?

We know diversity is important! In fact, 75% of today’s candidates look in to potential employers’ DE&I programs, and what they find influences their decision making. Plus, as we well know, the more diverse your workforce, the better your business outcomes!

Recommendation: Take a gander at how diverse the profession is in your state and see how well your DE&I performance measures up. If you find you’re falling a bit short, have no fear! There are a plethora of relevant job boards to give your DE&I program the oomph it needs

Source: Joveo Research

Occupational Gain to Attract and Retain

By understanding what occupations laborers come from, you can tailor your job ad content and channels to reach those audiences, in addition to the standard talent supply in your location. For example, many were previously employed as stockers and order fillers, retail sales folks, or customer service reps. Shazam!

Recommendation: Identify the right channels with a combination of keyword research, using a programmatic job advertising partner with publisher-level historical data and expertise. Now go get those great-fit candidates!

Source: Joveo Research

Curious about how your own talent sourcing and recruitment advertising efforts compare? Find out what it takes to be best-in-class and leave your competition in the dust.