Interactive Insights

Recruiting Food Preparation Workers

A Deep Dive into Talent Sourcing and Recruitment Advertising Benchmarks

Food Preparation Workers

A Bit About These Talented Professionals

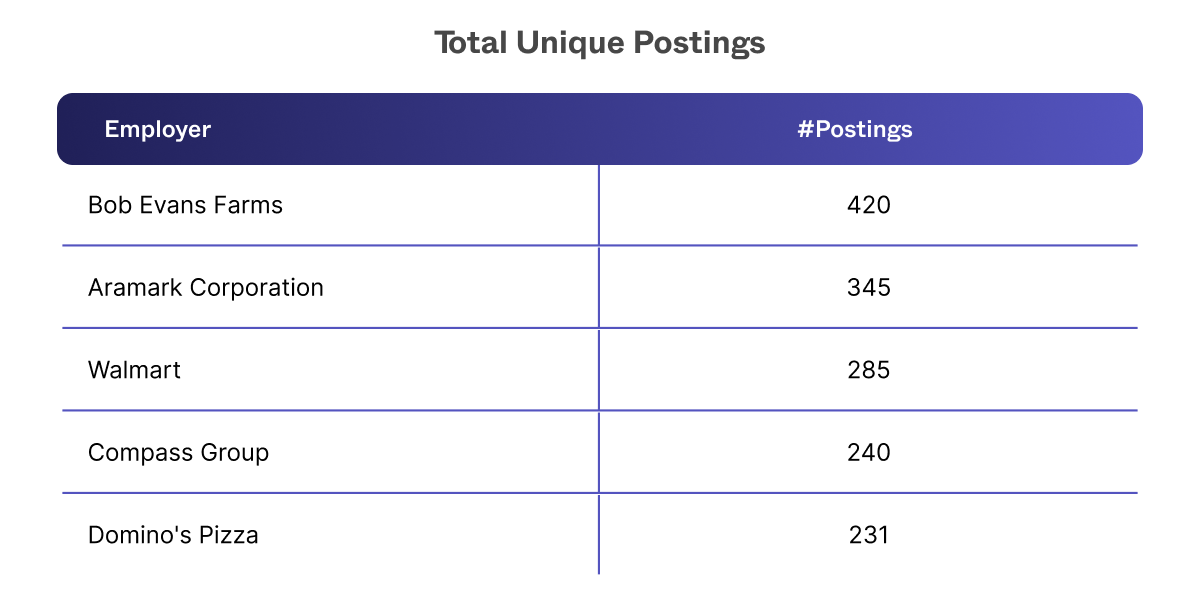
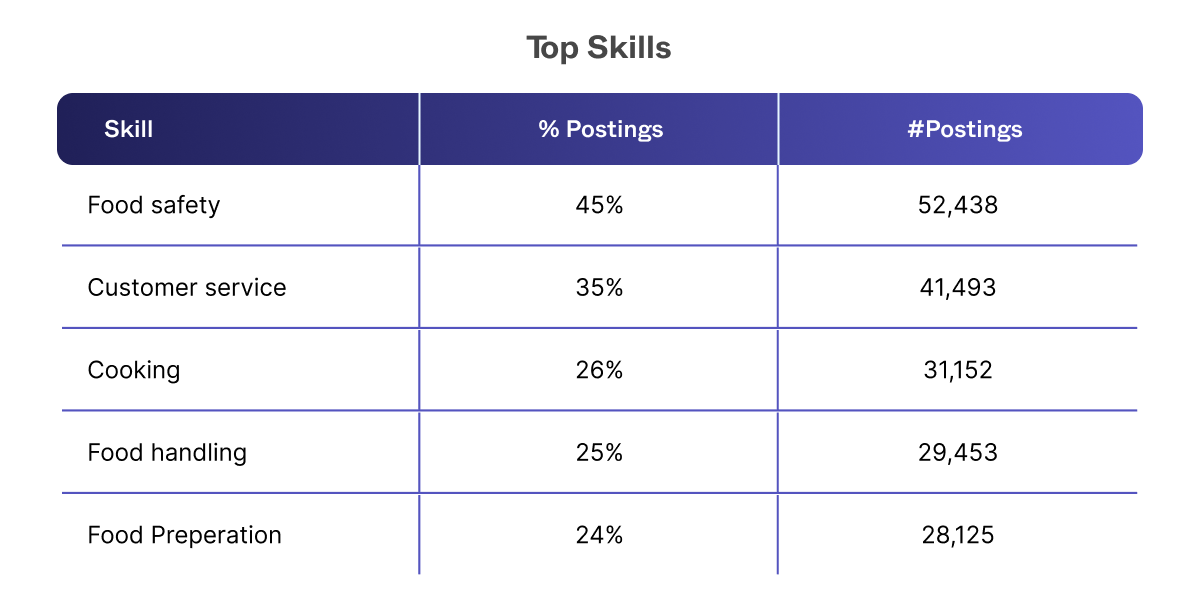
Working tirelessly behind the culinary scenes, more than 800,000 food prep workers bring flavor to life under the guidance of chefs and cooks, ensuring seamless kitchen operations and delightful dining experiences.

But what’s the projected outlook for the occupation, you ask? Well, after coming out of deep freeze during the pandemic, employment growth for food preparation workers is projected to be slower than the average for all occupations, at 2% through 2031. Between occupational drain and job creation, this means 146,000 openings per year.

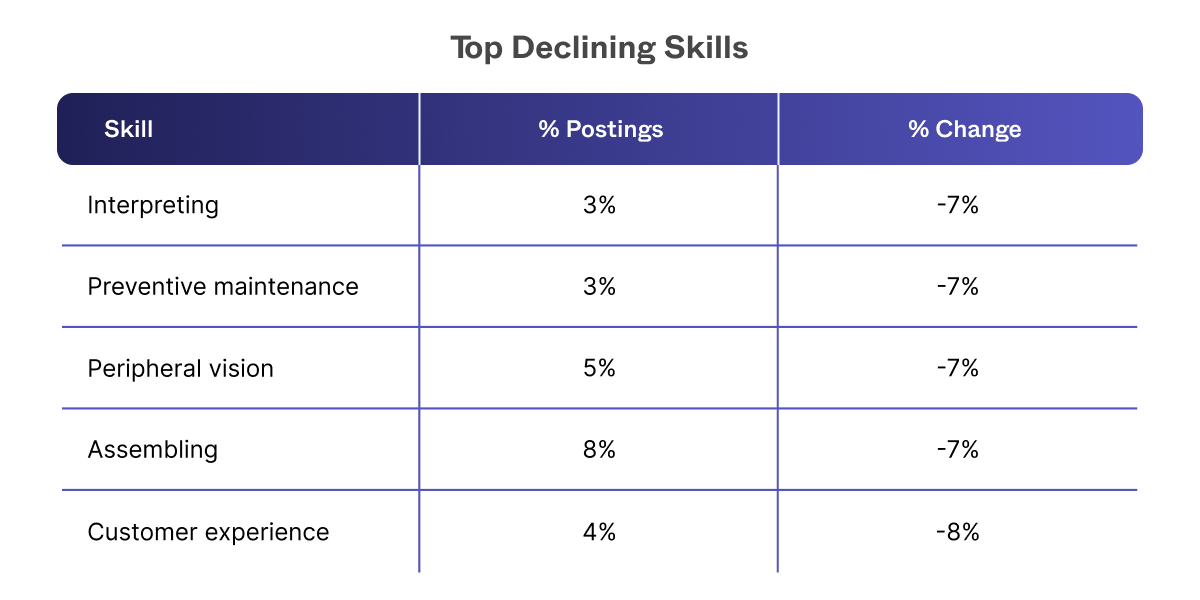
Sluggish growth is related to a number of factors. For one, some restaurants are opting for pre-washed, pre-cut, and pre-seasoned foods from wholesalers to save on costs. And hey, who can blame them for seeking a little convenience? Secondly, there’s a pinch of automation sprinkled in, too! While we’re not quite at the era of robot chefs, larger chains are cautiously embracing technological wonders. We have also seen the rise of ghost kitchens, consolidating operations into lean, mean, food prep machines.

Ready to find the perfect recipe for recruiting success, at the optimal cost?

It’s time to let Joveo’s data do the talking!

0%
Year-on-year decrease in CPC
0%
Year-on-year increase in median advertised salary
0%
Year-on-year decrease in unique postings

CPA App-lause or App-loss

CPAsCost per application (CPA) measures the cost incurred by an organization to receive one job application from a potential candidate. depend on CPCs, in addition to a number of other factors! While you can’t control everything (ex. market conditions) you can definitely work on honing that apply process. Here are a few factors to consider: candidate experience, employer brand, CPA, recruiter time and effort, and application quality.

While easy apply CPAs are low, they may attract unqualified or disinterested candidates! On the other end of the spectrum, a lengthy apply can lead to high applicant drop-off, poor CX, and a high CPA.

Recommendation: Evaluate your process to figure out what info your team needs. Whether you opt for easy apply, an enhanced ATS-based approach, or another route, ensure that your recruitment strategy is grounded in data.

Source: Joveo and Lightcast Research

CPC, Ya You Know Me!

Nationally, we are seeing an average CPCCost per click (CPC) is the cost incurred by an organization for each click on a job advertisement or recruitment campaign. of $0.73… but that’s not going to help you plan, is it? Drilling down to CPCs by state, we find quite a range! Delawar shines with CPCs in the $0.38 range. On the flip side, Wyoming’s average CPC is a whopping $1.60.

Recommendation: Make sure you get the most bang for your buck! Leverage this data, understand seasonality and macro trends, and stay nimble. Track and compare performance across states and do a little A/B testingA/B testing refers to a randomized experimentation process. Two or more versions of a variable (job title, job description, etc.) are shown to different segments of users at the same time. The goal is to determine which version leaves the maximum impact and drives conversions. to optimize those CPCs and conversion rates.

Source: Joveo and Lightcast Research

Demand-Supply: The Golden Ratio

There’s a definite trend in these numbers – seasonality! Overall, the occupation brags a staggering 19.17 demand-supply ratio, ranging from 15 to 23 throughout the year. What does this mean, you ask? Well, a whopping 19 hires (on average) are made for every job posting.

Recommendation: If your ratio is less than 19.17, we strongly recommend an old fashioned recruitment marketing audit. That means reviewing job titles, descriptions, compensation, and benefits compared with your competition. Oh, and how could we neglect reach, ad dollars, and return on ad spend per source!

Source: Joveo and Lightcast Research

Mind Your Demand-Supply Gap… by State

Wondering just how aggressive your sourcing needs to be in a given state? Well, this chart will come in mighty handy, giving insight into the demand-supply gap The demand-supply gap is calculated by dividing the number of unique job postings by total employment in the occupation. The higher the number, the greater the demand-supply gap, compared with the national average., and indicating just how hard you need to push when it comes to talent sourcing or job advertising.

For example, if you’re looking to hire in Louisiana, Texas, or Maine, you shouldn’t have a problem. In fact, these three top our list of easiest to fill states when we take a look at demand and supply of food prep workers. On the other end of the spectrum, filling your hiring funnel in Hawaii, Michigan, and North Dakota is going to be a challenge, given the low supply and high demand!

Recommendation: If the color of your state is in the deep gold, it may indicate that you need to give your job content a makeover, A/B test titles A/B testing refers to a randomized experimentation process. Two or more versions of a variable (web page, job description, etc.) are shown to different segments of users at the same time. The goal is to determine which version leaves the maximum impact and drives conversions., expand across locationsGeographic optimizations expand the targeted location to include surrounding communities. This is an easy way to extend your reach and reduce CPAs by sourcing from less competitive markets., and spend considerably more on recruitment marketing and job advertising to attract all the great-fit candidates you need to fill your funnel.

Source: Joveo and Lightcast Research

Who Posts the Most?

We see an average posting intensity Posting intensity is the ratio of total job postings to unique job postings. A higher posting intensity means employers are sending copies of their reqs to several job sites or other locations on the web, to reach a bigger talent pool. of 3:1 across the occupation, reflective of relatively lower demand. Top employers like Golden Corral, Dairy Queen, and Ruby Tuesday distribute their jobs in line with the national average, while other well-known brands like McAlister’s Deli and Carrabba’s Italian Grill go a step further (5:1), beating the national occupational average. Sodexo tops them all with a posting intensity of 12:1!

Recommendation: Be sure to get your posts out to all the right job boards and on social media. We’re admittedly biased, but one great way to automatically post jobs across best-performing sites is to use programmatic job advertising – plus you can take advantage of job title Job title expansion means leveraging alternative job titles, using commonly searched terms. These are published as new listings in addition to the original post. and geographic Geographic optimizations expand the targeted location to include surrounding communities. This is an easy way to extend your reach and reduce CPAs by sourcing from less competitive markets. expansions.

Source:Joveo and Lightcast Research

Show Candidates the Money!

While the national median salary is approximately $30,000, advertised median salaries over a 12-month period came in at $33,500, as of December of 2023. We typically see advertised and actual salaries so close when the demand-supply gap is lower within an occupation. Employers advertising salaries higher than this will definitely have a competitive advantage when it comes to sourcing.

Recommendation: If you offer a great salary, don’t forget to call it out in your job description, even if your state doesn’t enforce it legally. Currently, 59% of unique job postings for food prep workers include wage info. This will help you attract more candidates, lower CPCs, and fill your funnel faster.

Source: Joveo and Lightcast Research

An Eye on DE&I: How Do You Measure Up?

We know diversity is important! In fact, 67% of today’s candidates take a serious look at potential employers’ DE&I programs, and what they find influences their decision making. As we well know, the more diverse your workforce, the better your business outcomes!

Recommendation: Where do you fall, when it comes to diversity? Check out stats from the top and bottom three most diverse states when it comes to food prep workers. If you find you’re lacking, there are a plethora of relevant job boards to help spur your DE&I program on to greatness.

Source: Joveo and Lightcast Research

Occupational Gain to Attract and Retain

If you understand where your food prep workers come from, you can tailor your job ad content and channels to reach those audiences, in addition to the standard talent supply in your market. For example, many of these fine folks were previously employed as cashiers, retail sales associates, or customer service representatives.

Recommendation: Identify the right channels with a combination of keyword research, using a programmatic job advertising partner with publisher-level historical data and expertise. Now go get those great-fit candidates!

Source: Joveo and Lightcast Research

Curious about how your own talent sourcing and recruitment advertising efforts compare? Find out what it takes to be best-in-class and leave your competition in the dust.

Exclusive Insights: Free Report on the State of Recruitment in US Healthcare | Download Now →

X